
Define the Problem

Generating Concepts
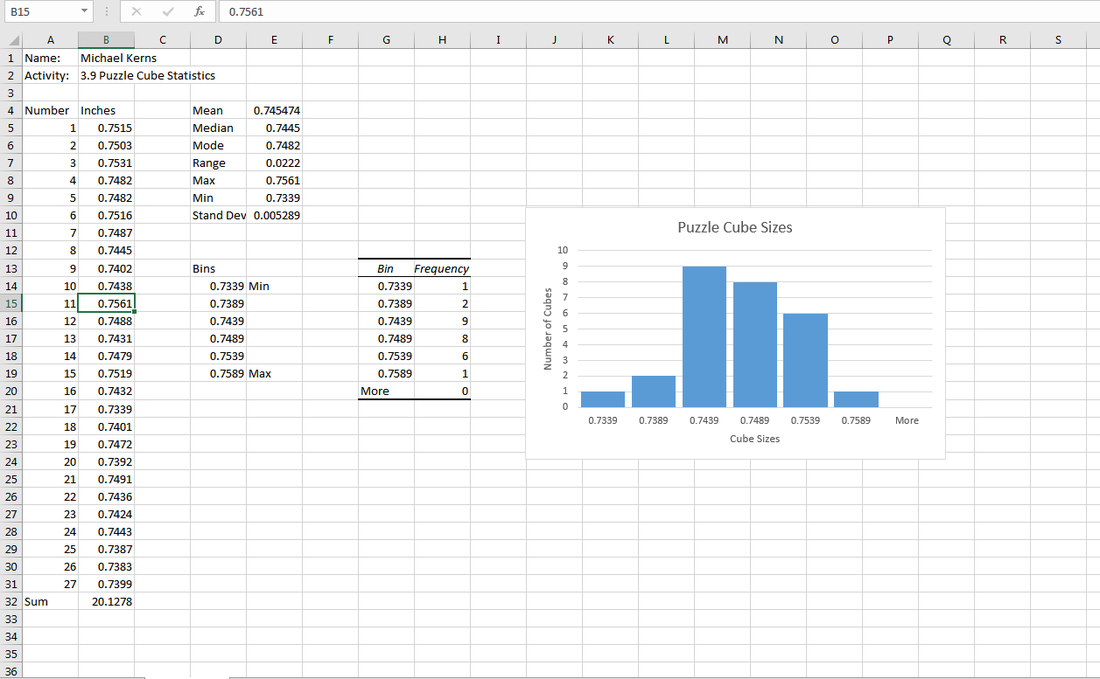
I got these measurements of each individual cube by first choosing 27 out of a random bag. Then I used a dial caliper and measured each one's length from grain end to grain end. After measuring I recorded every measurement onto the excel sheet and found the range, mode, mean, median, and standard deviation for the entire set. I did this to find out which measurements were outside two standard deviations from the average, and if they were I would dispose of them. The whole process was tone the make sure that the cubes were relatively even so when they made up the puzzle cube they all fit nicely.
Acceptable Range
The acceptable range is the range in which the blocks are close enough to my own average cube size to be used in the final product. I found this by adding two standard deviation values and subtracting two standard deviation values from my average. If a cube fell outside of the acceptable range it was disposed of.
Brainstorming Sketches

These are my original isometric brainstorming sketches of pieces which would combine to form the overall puzzle cube. These were made so I could decide what pieces my cube would be made out of and to get a representation of what they would look like and how many individual wooden cubes they would take to make.
Inventor modeled Pieces
Develop the Solution


Construct and Test the Prototype

Degrees of Freedom
Degrees of freedom are the ways something can move on an X-Y-Z axis. Taking away a degree of freedom restricts somethings movement. So if you took away somethings ability to go up and down, it then only has two other degrees of freedom in which it can move, in and out, and left to right. When modeling my cube with the previously modeled parts I had to take away all the degrees of freedom from the other parts so they wouldn't move or slide around the cube. This also gives precision because the cube can't become out of place once its mobility is taken away.

Evaluation
A multiple students got 44, 50, 122, and 234 seconds trying to solve my cube. Then and adult, my mom, took 10 minutes to salve it. From this data I can infer that my cube is suited for the younger crowd because the older, less experienced the person is when solving, the seemingly longer they take. Despite their times some complained about the roughness and unevenness of the cube. From this feedback, I would remake the cube and make all the the pieces fit together better and probably color it more evenly.
Presentation / Conclusion
In this project where I was tasked with compiling data, working with graphs and standard deviation, constructing a puzzle cube made from various parts to achieve the goal of making a young children's toy from wood-work waste. The cube had to be made of 5 parts of which had to be made from 4-6 wooden pieces each. In the process I was taught how to use the program called Inventor to model and create multi-views of my parts. I used its various features to also digitally assemble my cube and produce pictures at various points in my work process. Most of my Develop a Solution stage in my Design Process was taken up by Inventor, but the program also played roles in the Constructing and Testing the Prototype and Generating Concepts stages. My use of Excel was also a big part in my Design Process, specifically the Generating Concepts stage. I was taught how to list data and use various functions to find range, median, mode, mean, standard deviation, and create a histogram during the Develop a Solution stage. Overall this project taught me a lot about modeling and using Excel as a calculation software all while using the Design Process to get a final, evaluated product.
